
Tetouan是摩洛哥北部的一座城市,位於地中海沿岸,冬季氣候溫和多雨,夏季炎熱乾燥。摩洛哥在2015年關閉唯一煉油廠後,所有石油產品都是進口的(20萬桶/日),耗電數據是從Amendis的監督控制和數據採集系統(SCADA)收集的,該系統是一家公共服務運營商,自2002年以來一直負責飲用水和電力的分配。配電網路的目的是為Tetouan的中低壓消費者提供服務。為此,Amendis確保從交付點到最終使用者(客戶)的電能交付和分配。分配的能源來自國家電力和飲用水辦公室。將高壓(63 kV)轉換為中壓(20 kV)后,可以傳輸和分配能量。[1]
數據包括 10 分鐘視窗內的 52,416 次能源消耗觀測值,觀測值包含:
1. Date time: 每十分鐘做紀錄
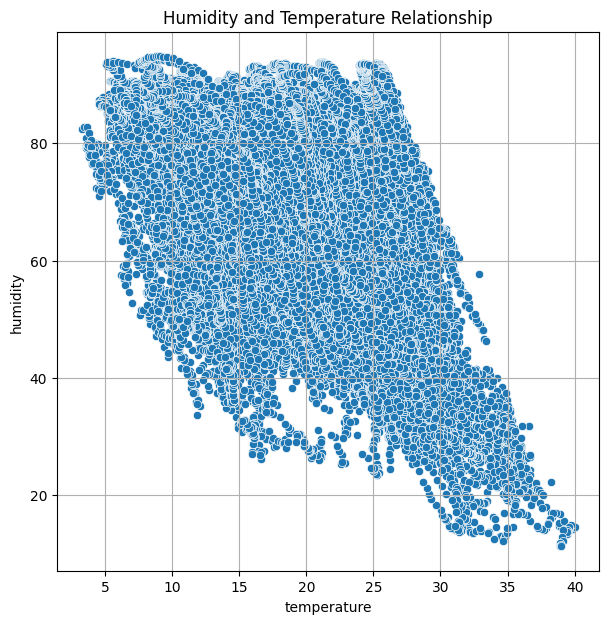
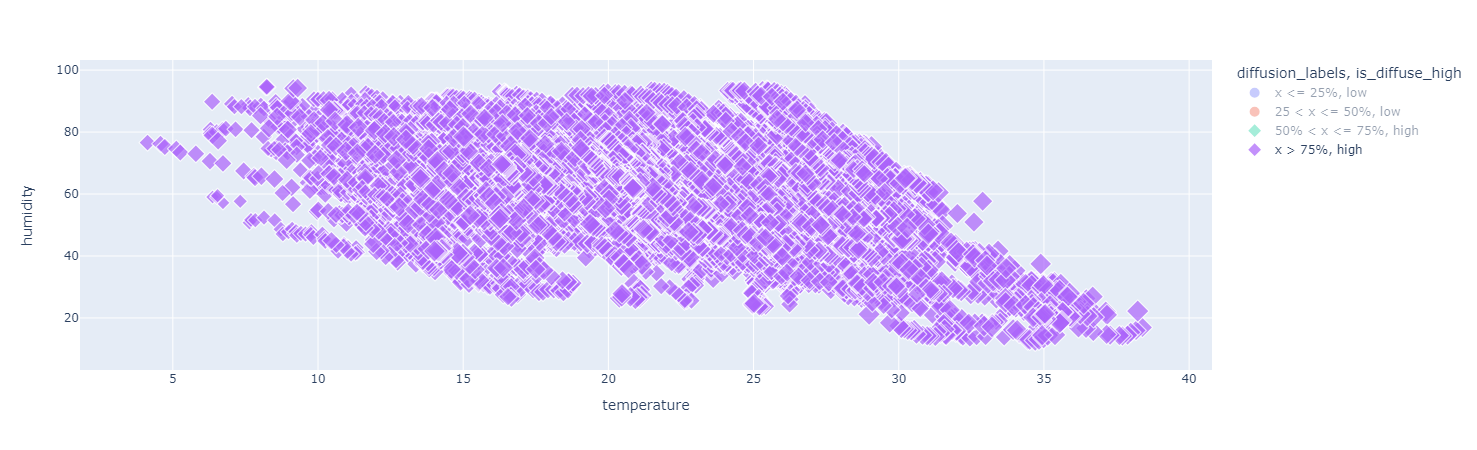
2. 溫度
3. 濕度
4. 風速
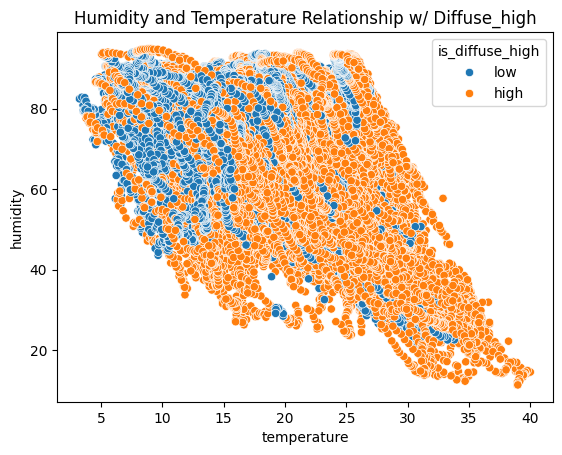
5. General Diffuse Flows(一般擴散流): 描述低溫(<0.2 °C 至 ~ 100 °C)流體,這些流體通過硫化物丘、裂縫熔岩流以及細菌墊和大型動物群的組合緩慢排出。
6. 擴散流
7. 區域1功耗
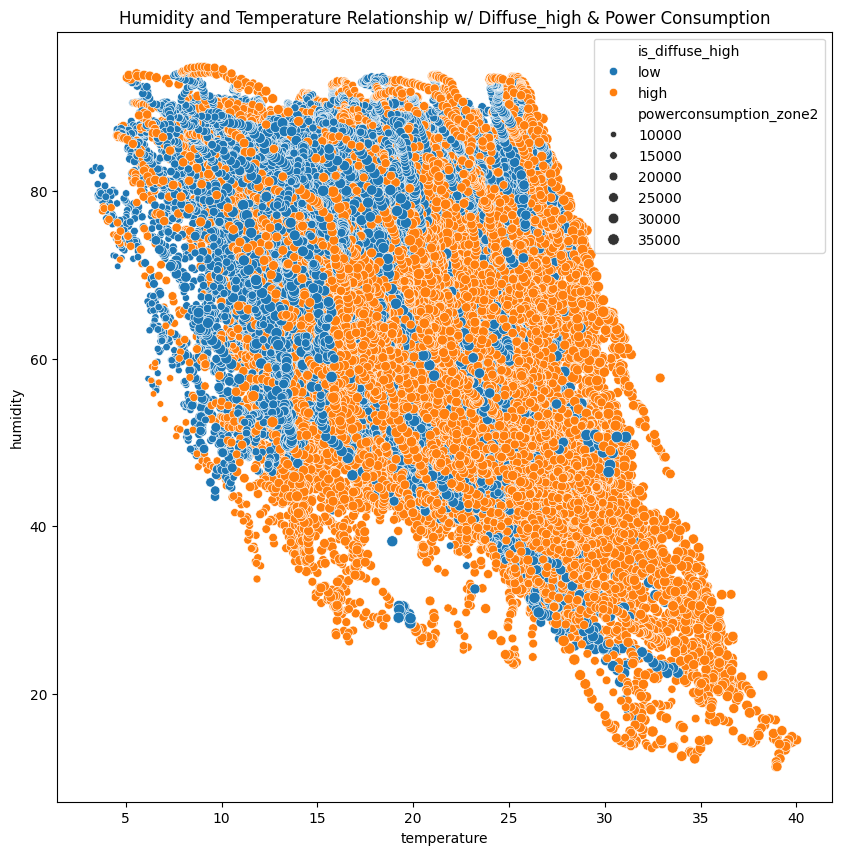
8. 區域2功耗
9. 區域3功耗

data在kaggle上Electric Power Consumption page上取得。
                    DatetimeIndex: 52416 entries, 2017-01-01 00:00:00 to 2017-12-30 23:50:00
                    Data columns (total 6 columns):
                        #   Column                  Non-Null Count  Dtype
                    ---  ------                  --------------  -----
                        0   temperature             52416 non-null  float64
                        1   humidity                52416 non-null  float64
                        2   windspeed               52416 non-null  float64
                        3   generaldiffuseflows     52416 non-null  float64
                        4   diffuseflows            52416 non-null  float64
                        5   powerconsumption_zone2  52416 non-null  float64
                    dtypes: float64(6)
                    memory usage: 2.8 MBRangeIndex: 1000 entries, 0 to 999
| temperature | humidity | windspeed | generaldiffuseflows | diffuseflows | powerconsumption_zone2 | |
|---|---|---|---|---|---|---|
| datetime | ||||||
| 2017-01-01 00:00:00 | 6.559 | 73.8 | 0.083 | 0.051 | 0.119 | 16128.87538 |
| 2017-01-01 00:10:00 | 6.414 | 74.5 | 0.083 | 0.070 | 0.085 | 19375.07599 |
| 2017-01-01 00:20:00 | 6.313 | 74.5 | 0.080 | 0.062 | 0.100 | 19006.68693 |
| 2017-01-01 00:30:00 | 6.121 | 75.0 | 0.083 | 0.091 | 0.096 | 18361.09422 |
| 2017-01-01 00:40:00 | 5.921 | 75.7 | 0.081 | 0.048 | 0.085 | 17872.34043 |
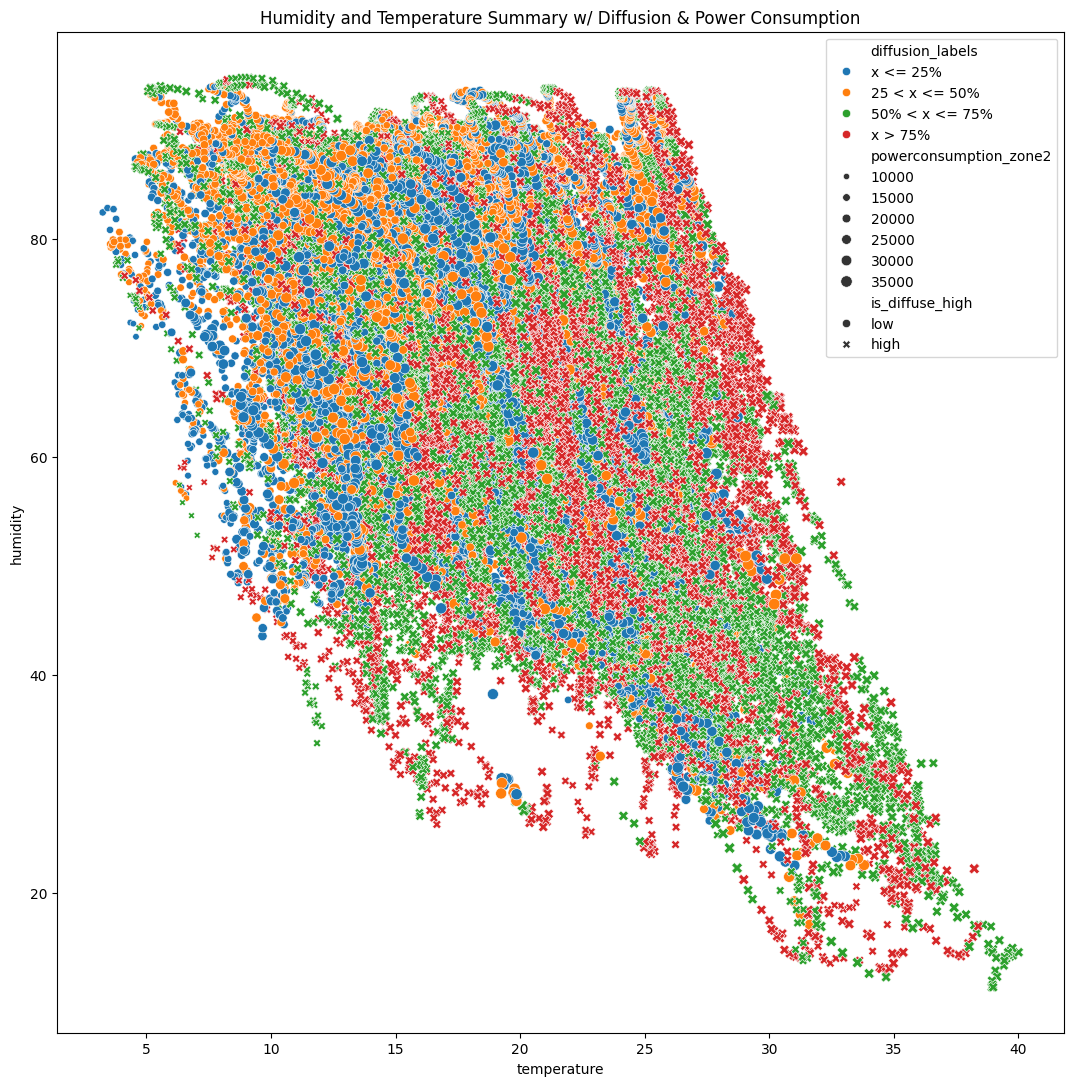
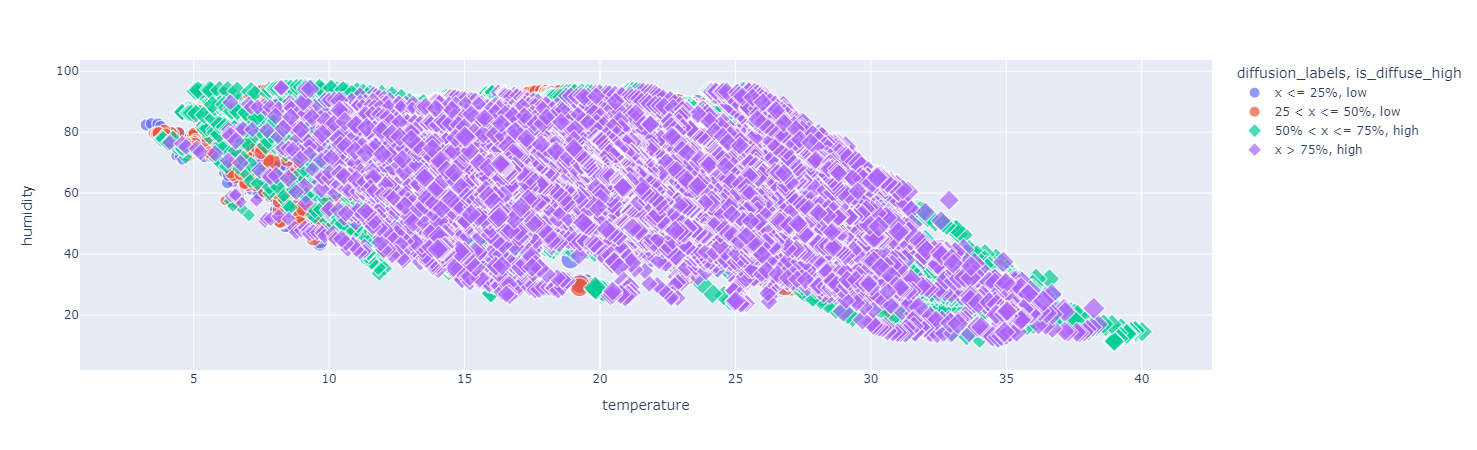
All
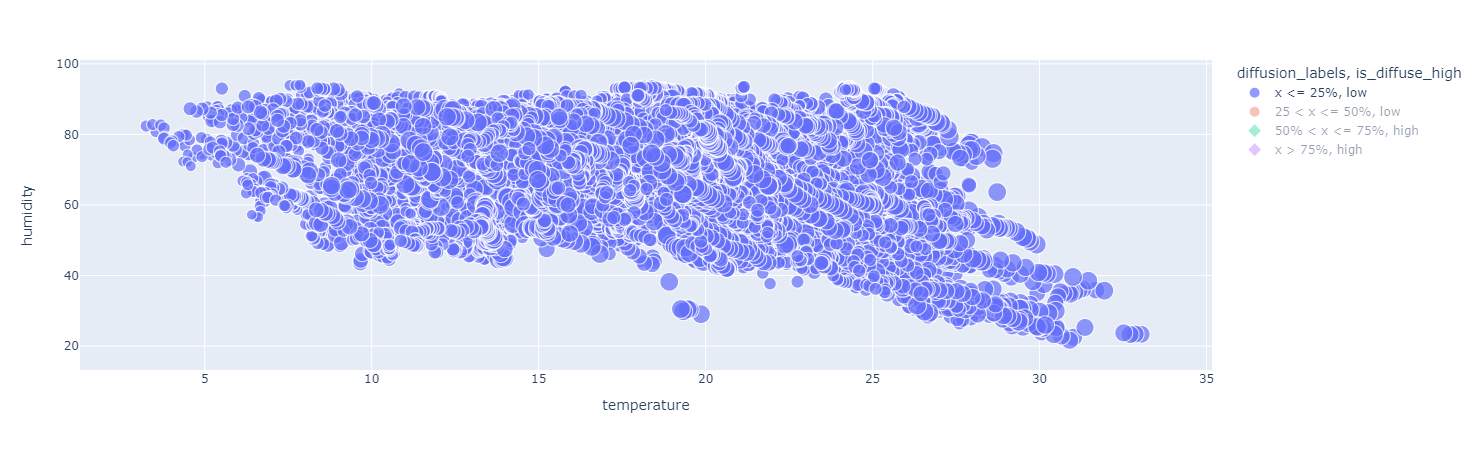
First quantile
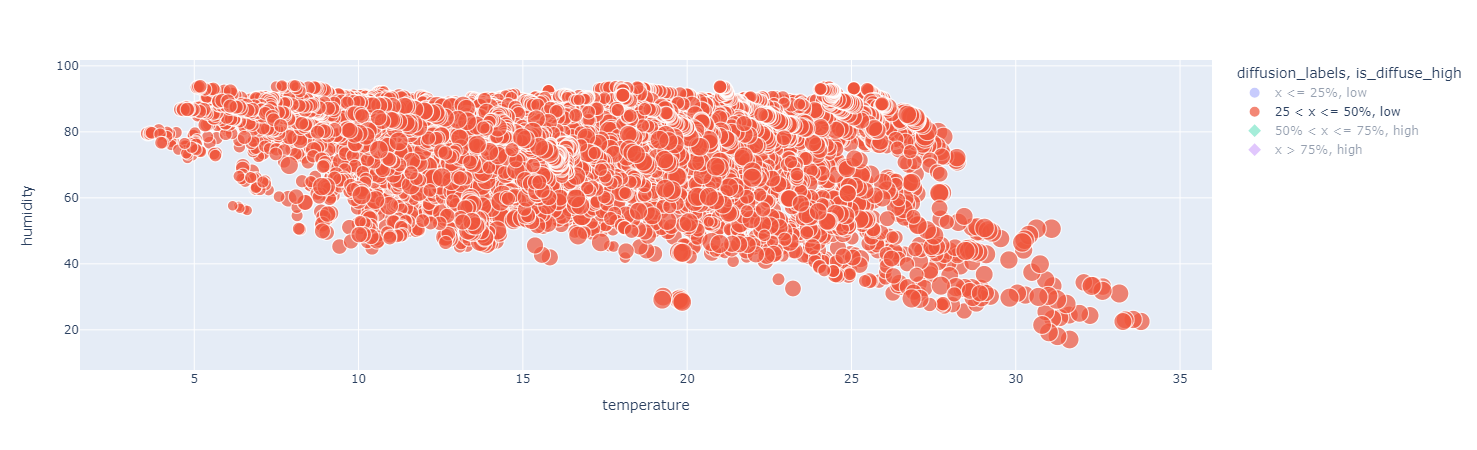
Second quantile
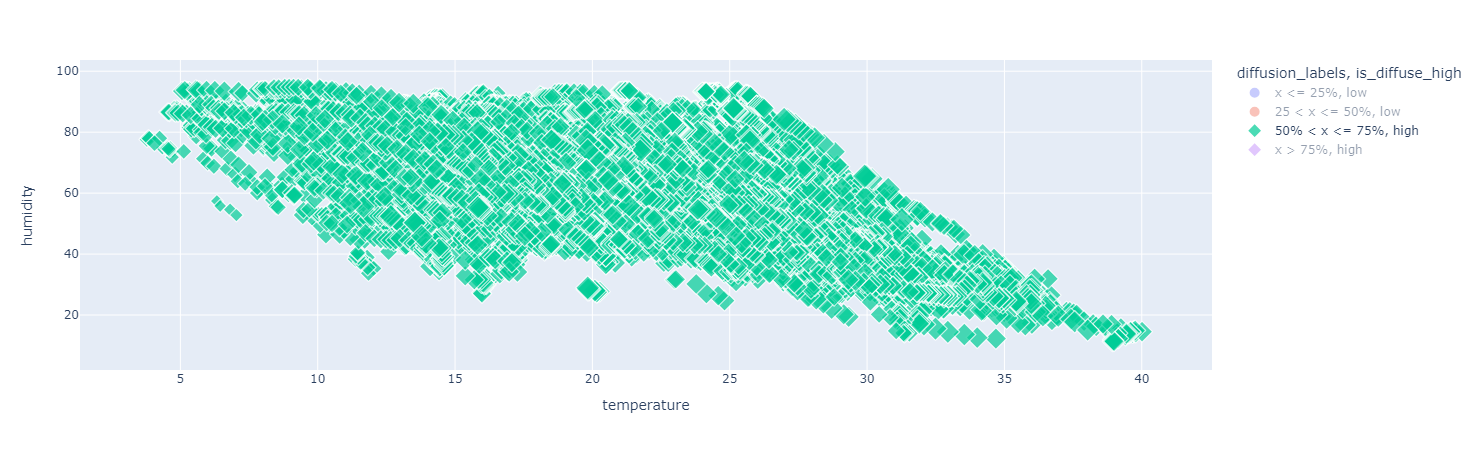
Third quantile
Fourth quantile
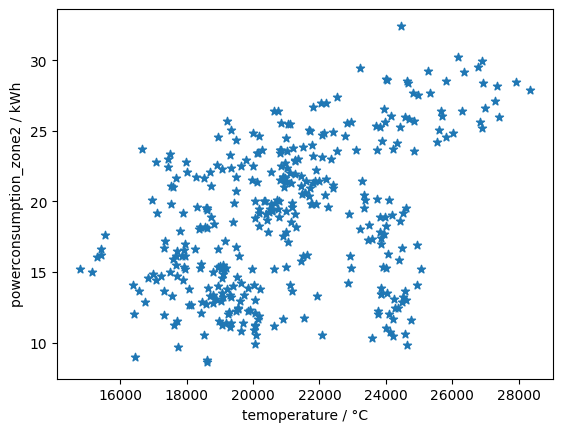
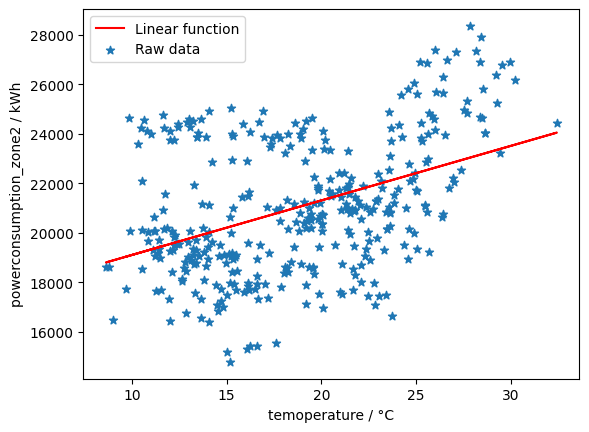
                    Function: power_consumption = temperature*220.41 + 16896.64
                    R^2 score: 0.17914777151851513
.png)
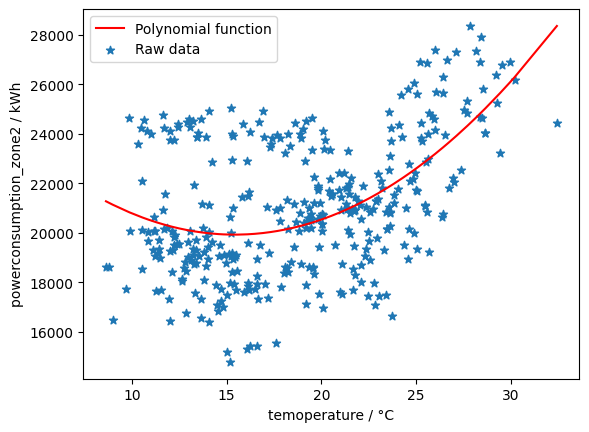
                    Function: power_consumption = 26861.28 * (temperature**0) + -899.67 * (temperature**1) + 29.16 * (temperature**2)
                    R^2 score: 0.26883141005067945
.png)
線性回歸沒有與原始資料相當擬合,因此我們嘗試用指數回歸去預測,得到的曲線與原始資料較相符,透過線性與指數回歸預測能得到溫度與電量使用量之間的R square值。